AI Attractiveness Test: How Attractive Am I, Really?
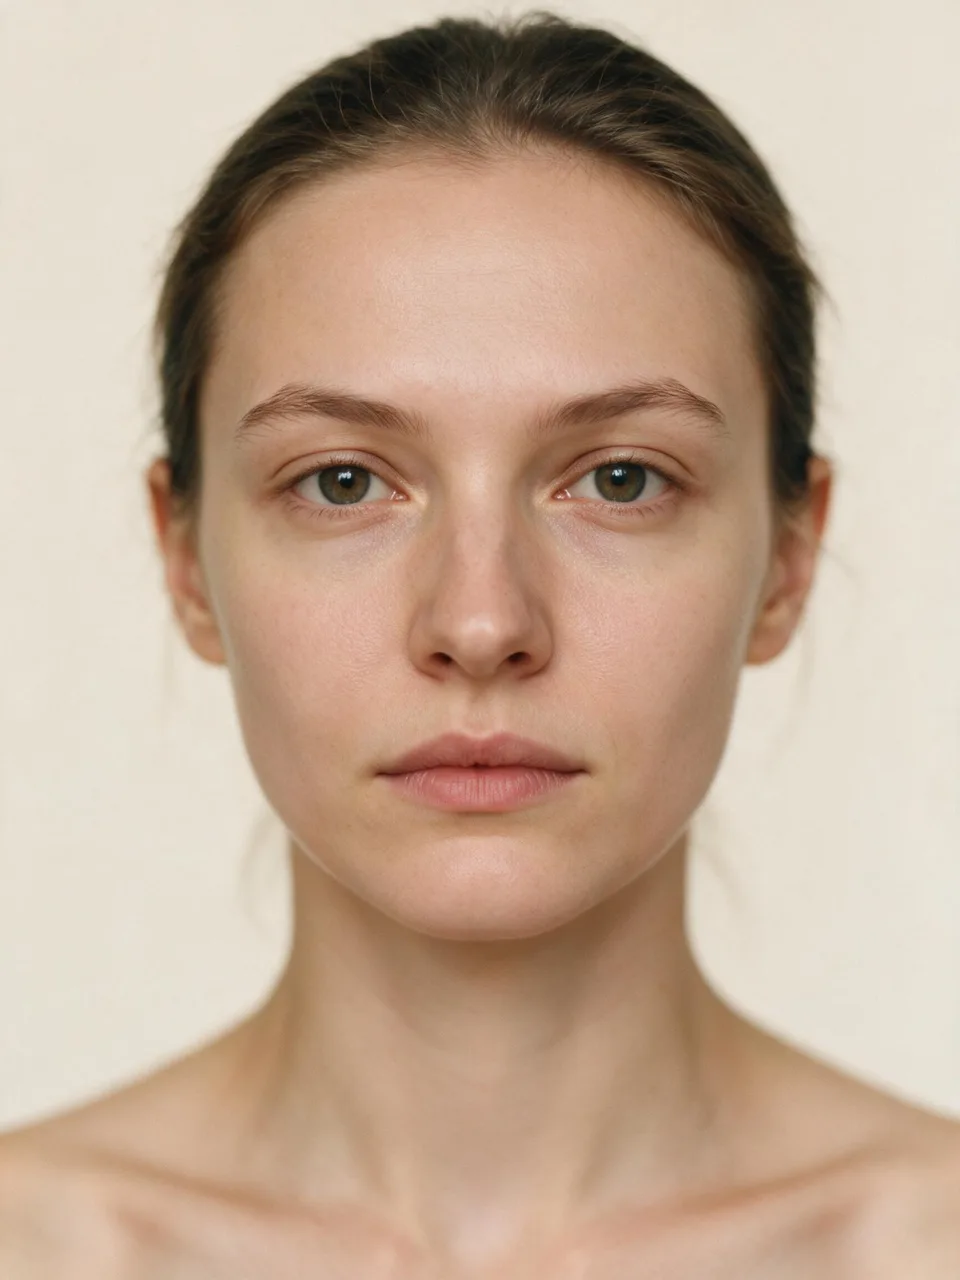
EXAMPLE ANALYSIS: 478 LANDMARKS MAPPED ON A SAMPLE PHOTO, NOT YOURS.
What a reading looks like
Real components · sample dataA starting line, not a verdict.
What we won't show you: a confidence band (not until our test-retest study ships) · a percentile (not until a reference population is published) · a skin score from one photo (lighting lies). Every "not scored" comes with its reason.
An AI attractiveness test scores a photo on measurable facial traits (symmetry, proportions, harmony, averageness and youthfulness) and returns a 1-10 value with the components behind it.
You get your attractiveness score, the five components behind it, and the photo conditions that moved it. The scan is free and runs in your browser: this AI facial analysis measures one photo, not your face.
The Short Version
How Attractive Am I? What This Test Can Answer
This test answers how attractive one photo of your face measures as geometry, on a 1-10 scale, against a formula published on this page. It cannot answer how attractive people find you, a different question with a different method.
The phrasing varies and the action does not. You can test attractiveness from a single photo, run an AI attractiveness test on a phone, or look for a test of attractiveness that shows its formula before it shows a number. Someone typing "attractive test" or "how attractive am I test" is making the same request in fewer words.
This instrument answers the measurable half of that request. It checks left-right symmetry, measures the thirds and fifths of your face, scans one frontal photo in about two seconds, and rates the geometry from 1 to 10. It does not answer whether someone found you attractive, or what your face does when you laugh. Those are real questions. Geometry is not the method that answers them.
Take the Test: What Happens in Your Browser
The test runs in four steps, and none of them sends your photo anywhere. The landmark model downloads to your browser once, then every landmark is measured on your device, in local memory. That is why the line under the scan says photos never leave your browser and invites you to open the network tab: the claim takes ten seconds to check.
- Choose a photo or open your camera. JPG, PNG, WebP and HEIC work, up to 10 MB.
- Let the mesh detect 478 landmarks on your device, including 10 iris points.
- Watch the geometry scored against the disclosed weights: symmetry 30%, thirds 20%, proportion 20%, fifths 15%, harmony 15%.
- Read your 1-10 score with its components, the flags that fired, and the four states the scan refuses to guess at.
Photo conditions move the number more than people expect, so the gate checks the photo before scoring it. Four habits keep a scan measurable.
- Rear camera at arm's length: front cameras distort width at close range.
- Head straight on: the gate blocks yaw over 10 degrees and pitch over 8, and flags roll over 5.
- Neutral expression, mouth closed: a broad smile moves the mouth, cheek and jaw landmarks and lowers symmetry.
- Even, front-on light: harsh side light shifts the jaw contour the mesh reads as your outline.
A photo that fails the gate returns a named reason and a retry, never a number with a shrug attached. Every flag names its axis and its direction of effect: "yaw 14 degrees, symmetry understated".
What the AI Measures: Symmetry, Proportions, Harmony, and Youthfulness
Facial attractiveness, measured as a construct, is composed of symmetry, facial proportions, facial harmony, averageness, sexual dimorphism, youthfulness and skin quality. Score v1.0 scores five of those seven and names the rest as not scored, each with its reason printed beside it. The scan draws a 478-point mesh over your photo, fits a midline through it, and measures every component against that mesh.
Symmetry
Symmetry is how closely paired landmarks on the left and right of your face mirror each other across a fitted midline. The scan mirrors paired mesh points across a midsagittal axis fitted by principal component analysis, not assumed vertical. It reports mean deviation as a 0-100 value carrying 30% of the composite, the heaviest single weight. Fitting that midline matters: on a symmetric test face tilted 2 degrees, a naive vertical midline scores 42 where the fitted one scores 100. Research supports symmetry at small to moderate effect sizes [3][5], so you can measure your facial symmetry precisely and still be measuring a modest slice of the answer.
Facial proportions: thirds, fifths, and fWHR
Facial proportions are three measurements: thirds divide face height into forehead, midface and lower face; fifths divide face width into five eye-width segments; fWHR is bizygomatic width divided by upper-face height. Thirds carry 20% of the composite, the golden-ratio proportion 20%, and fifths 15%. fWHR is reported but never scored, because it describes dimorphism, not quality. One limit belongs in this section, not in a footnote. The mesh's top landmark sits at the top of the forehead, not the hairline, so a phi-proportioned face measures near 1.38 over the visible window instead of 1.618. That adjusted target is what the golden ratio and facial ratios calculator scores against.
Facial harmony
Facial harmony is the agreement between your components, not a second average of them. The scan converts each component to a z-score, measures the dispersion across those z-scores, and reports low dispersion as high harmony at 15% of the composite. A face scoring 70 on every component measures as more harmonious than one scoring 95, 45 and 70, even though the averages match. Averaging would hide that gap, so harmony scores the spread instead.
Averageness and sexual dimorphism
Averageness is how closely a face resembles the mathematical average of many faces, and sexual dimorphism is how strongly a face expresses typically male or typically female traits. The counter-intuitive finding is that composites built by averaging many individuals are rated more attractive than nearly all the faces inside them [4]. Score v1.0 scores neither of them, and the result says why: both need a reference-population embedding this instrument does not have yet.
Youthfulness and skin quality
Youthfulness is apparent age measured against actual age, and it appears here as a non-clinical line only: no dermatology, no diagnosis, no treatment advice. Skin quality is not scored at all on the free scan, because lighting, camera processing and compression change apparent skin more than skin itself does. A separate face age tool estimates apparent age. Neither measure enters the Score v1.0 composite.
The Attractiveness Score: Your 1-10 and Your Percentile
Your attractiveness score is a 1-10 value computed from five weighted geometric components measured on one photo. Your percentile is a separate claim about where that value sits in a reference population, and Score v1.0 does not publish one yet.
The two numbers answer different questions. A score answers how this photo measured against a published formula. A percentile answers how that measurement ranks among other people, which requires a population. Most face raters print both and disclose neither.
The score is computed live: five components, each on a 0-100 scale, combined at weights of 30, 20, 20, 15 and 15 percent, then expressed on the 1-10 scale this site uses everywhere. Run one photo twice on the same score version and the value holds to the decimal. The table states what the percentile will be computed against, and what stays blank until it is real.
| The claim | Its status in Score v1.0 |
|---|---|
| What the percentile is computed against | Our own scan corpus, once it is large enough to publish. Not a national average, not a beauty database. |
| Sample size | Not published. A percentile with no stated n is decoration, so the line stays empty until the n is real. |
| Confidence band | Not shown. The band renders after a test-retest study measures how far a repeat scan of one face moves. |
| What the score is not | Not a ranking of people, not a prediction of how anyone treats you, not a clinical measure. |
Both blank lines cost us a number on the result card. They also keep the numbers we do print worth reading.
What the Evidence Says About Facial Attractiveness
Raters agree about which faces are attractive more than "beauty is in the eye of the beholder" suggests. According to Langlois and colleagues in Psychological Bulletin, 2000, agreement inside one culture runs at about r = 0.90, and cross-cultural agreement stays high [1]. That licenses nothing about one person's taste: Hönekopp, in the Journal of Experimental Psychology, 2006, found private taste accounts for roughly half the variance in ratings of the same faces [2].
Averageness predicts attractiveness. Langlois and Roggman, in Psychological Science, 1990, found composites of 16 and 32 faces were rated more attractive than almost every face averaged into them [4]. That does not license "average" as an insult or a target, and it is why this scan withholds an averageness component until it has a population to average.
Symmetry predicts attractiveness at a small to moderate effect. Rhodes, in the Annual Review of Psychology, 2006, reports symmetry, averageness and dimorphism as reliable but modest predictors [3], and Grammer and Thornhill measured the association directly in 1994 [5]. It does not license symmetry as the driver: Jones and Jaeger, in Symmetry, 2019, found averageness and dimorphism predicted female attractiveness while symmetry did not survive their controls [6]. Symmetry carries the heaviest weight here because landmarks measure it most reliably, which is a measurement argument rather than an evidence claim.
Sexual dimorphism shifts preferences, and not in the direction most looksmax content assumes. Perrett and colleagues, in Nature, 1998, found female raters preferred slightly feminized male faces to masculinized ones [7]. That does not license a masculinity target, because preference varied by rater and by task inside the same study.
The golden ratio is the weakest claim on this list. Holland, writing in 2008, showed the phi mask fits fashion models rather than the general population [8]. Pallett, Link and Lee, in Vision Research, 2010, found optimal facial ratios sit near population averages instead of at 1.618 [9]. Neither licenses phi as a law of beauty. We score the proportion component anyway, at a disclosed weight, as a convention we measure rather than a constant anyone discovered.
Attractiveness Tests, Quizzes, Raters, and ChatGPT Prompts
Four methods answer the attractiveness question, and they measure four different things. The table compares what each one measures, whether it repeats, and what it costs.
| Method | What it measures | Reproducible? | What it costs |
|---|---|---|---|
| Photo measurement test | Facial geometry: symmetry, proportions, harmony | Yes. Same photo and same score version, same number | Free here. Subscription raters charge weekly |
| Self-report quiz | Your own answers about your face and your experience | Partly. Answers move with your mood | Usually free |
| ChatGPT prompt | A language model's description of a photo, in words | No. The same photo and prompt return different answers | Free to low cost |
| Human raters | How a specific group rated you on a specific day | No. Ratings move with the raters | Free to ask, hard to get honestly |
Only the photo measurement repeats, and repeatability is what makes a number worth tracking. A quiz measures self-perception, a real answer to a different question, and the am I pretty quiz is built for it. Human ratings carry the taste geometry misses and lose it when the raters change.
Language models sit in their own category. Asking a chat model to rate a face produces fluent, confident, unstable output: the same photo scores differently across sessions, and the model shows no formula because it has none. We ran that comparison in the ChatGPT attractiveness test, tested. Use a chat model for description, a measurement tool for numbers you plan to compare.
Hot Test, Beauty Test, Face Rater: Same Measurement, Different Words
A hot test, a beauty test and a face rater run the same measurement as an attractiveness test, in different words. The vocabulary tracks the question you were asking. "Am I pretty" and "am I hot" are the self-directed phrasings, "beauty score" asks for a number, and "rate my face" or "face rating" asks for an act. The landmarks, the weights and the output stay the same.
We mirror those words because they are the words people search. We do not adopt them as verdicts. This instrument returns a number, its components, and a list of what it did not measure. It never labels a face hot, pretty or ugly, and it ships no tier names. If you arrived through the rating phrasing, rate my face runs this same engine with the rating question on the front.
Male and Female Score Norms
Male and female scores are compared against different reference distributions, which is why identical geometry can rank differently for a man and a woman. The measurement itself does not change: the same 478 landmarks, the same five components, the same published weights, computed in the same order.
| Reference distribution | What differs |
|---|---|
| Male reference | A value is ranked only against other male faces, on the same components and weights. |
| Female reference | A value is ranked only against other female faces, on the same components and weights. |
| Neither | The raw component values, computed identically before any comparison happens. |
What that does not mean: that either distribution scores higher, or that a score changes meaning by sex. A percentile is a position inside a group, not a grade. Both distributions stay unpublished until each one is large enough to state its sample size.
What This Score Cannot Tell You
This score measures one photo against one aesthetic tradition, and six limits bound everything above. A measurement you cannot argue with is a measurement you cannot check, so they are stated in full.
None of that is a reason to distrust the score; it marks the boundary of what the score is about. The full treatment, including how the weights were set and where the method fails, is in how we measure attractiveness and where it fails. If thinking about your face has stopped feeling like curiosity, the National Alliance for Eating Disorders helpline is free and answered by clinicians.
You Have a Number Now: What Does It Actually Mean?
The number you just got is a position, not a description. What your score means splits into three questions: whether that position is good, whether to believe it, and what to do next. The three sections below take them in that order.
The score bands, 1 to 10
A 7 out of 10 is above average on this scale. It sits above the midpoint, in the band where most measured components land near or above balance, and it describes a photo's geometry rather than a person.
The bands are fixed site-wide, so a 7 here carries the same meaning as a 7 on every other instrument on this site. They describe distance from the formula's balance points, not tiers of person, which is why this site ships no tier names. Bands 1 to 3 mean several components sit far from balance, usually with a photo flag attached. Bands 4 to 6 cover the middle, where most measured faces land. Bands 7 to 10 mean the components agree and sit close to balance. The full ladder, and the research behind each boundary, is in what a 1-10 attractiveness score really means.
The accuracy question: is this test legit?
The attractiveness test is legitimate as a measurement and limited as a judgment, because it publishes its formula, versions every change to it, and returns the same number for the same photo every time.
Legitimate means two things here, and neither of them means right about you. First, the method is disclosed: 478 landmarks, five components, weights of 30, 20, 20, 15 and 15 percent, and a version string printed beside your score. Second, the measurement is reproducible: run one photo through Score v1.0 twice and the value holds to the decimal. Reproducibility is a narrower claim than accuracy, and the narrower claim is the one this instrument defends. The statistics sit in our published formula.
What changes it
Three tiers of change act on your score, ranked by evidence rather than by how often they are sold.
- Immediate and large: photo conditions. Camera distance, lens, head angle and light move measured symmetry and proportion within one session.
- Moderate and real: grooming and styling. Hair across the forehead window, brow shape, facial hair and body composition shift landmarks over weeks.
- No measurable effect: bone claims. Mewing, chewing devices and bone smashing do not remodel adult facial bone, and no landmark here moves.
That order follows the evidence, and it is the order to work in. The evidence behind each tier sits in what actually makes a face read as prettier.
If You Asked a Different Question
Four sibling pages ask this measurement in a different question's words, and each changes what happens around the number, not the number itself.
If you typed am I pretty, that page puts the self-directed question on the front and adds the quiz path for people who want an answer without a photo.
If you typed "am I ugly", that page runs the identical scan with a duty-of-care frame around the result. It states the population reality before the number, because that phrasing arrives in a different mood.
If you came from the Pretty Scale test, that page covers the 2013 tool people still search for, what its scale measured, and where its method differs from a landmark mesh.
If you came from looksmaxxing vocabulary, the glossary defines the terms neutrally and grades the interventions by evidence, without adopting the ideology that produced them.
Measure One Feature at a Time
Every component in the composite has its own instrument, and each one answers a narrower question with the same engine and the same weights.
- Facial symmetry: left-right landmark agreement across the fitted midline.
- Golden ratio and facial ratios: the proportion set, scored against the visible-window target, not 1.618.
- Canthal tilt: the angle between your inner and outer eye corners, positive, neutral or negative.
- Face shape: the outline classification most styling decisions are built on.
- Jawline: gonial angle and jaw width, measured rather than judged.
- Face age: apparent age against actual age, non-clinical, outside the composite.
Running one instrument commits you to none of the others. One pass through the full AI face analysis measures the whole component set and returns each number with its own definition. Free tools and paid report are one instrument with one formula behind them, which is the whole point of The Attractiveness Report.
Not medical advice. This is a measurement of a photo, not a diagnosis, a clinical assessment, or a verdict on you.
It measures geometry, not worth. The number tells you where you start. It never tells you what you are.
on every page
of this site
Your report, in full.
- Side profile
- Skin, measured properly
- Averageness
- Dimorphism
- Ranked plan
Paid photo deleted within 24 hours · never used for training
- 40+ measurements, 7 regionsPP. 2-9
- Side profile, from a second photoPP. 10-13
- What moved your score, rankedPP. 14-16
- Four week plan and day 30 re-scanPP. 17-20
Frequently Asked Questions
Is the attractiveness test legit?
The attractiveness test is legit in the measurable sense: it detects 478 landmarks on your device, scores them against weights published on this page, and returns the same number for the same photo every time. It scores facial geometry rather than people, and that bound is part of the answer.
How can I test how attractive I am?
You can test how attractive you are three ways: a photo measurement that scores facial geometry, a self-report quiz that scores your own answers, and asking several blunt people you trust. Only the first one returns the same answer twice.
Is there a way to tell how attractive I am?
There is a reproducible way to measure how attractive your face is as geometry, and no way to measure how attractive one specific person finds you. Shared judgment and private taste are close to equal partners in the research, so half of the question stays private by definition.
What is a good attractiveness score?
A good attractiveness score on this scale sits at or above the midpoint of 1 to 10, where the measured components land near balance and agree with each other. Treat the number as a starting line rather than a verdict.
Is this the same as a beauty test, hot test, or pretty test?
Yes: a beauty test, a hot test and a pretty test run the same measurement as this attractiveness test, in different words. The vocabulary changes with the question you typed; the landmarks, the weights and the output do not.
Is 7 out of 10 considered attractive?
A 7 out of 10 is above average on this scale: it sits above the midpoint, in the band where most measured components land near or above balance. It describes a photo's geometry, and the full band ladder is in the 1-10 attractiveness scale.
Which AI can rate your face?
Several kinds of AI rate a face: general chat models describe a photo in words, app-store raters return a score behind a subscription, and browser instruments measure landmarks and publish the formula behind the number. This one is the kind you can verify in your network tab.
Does the AI have racial or gender bias?
Facial analysis carries documented demographic error gaps: Buolamwini and Gebru measured up to 34.7% error on darker-skinned women against 0.8% on lighter-skinned men in commercial classifiers. The proportion canons this scan uses came from European anthropometry, so we publish how we test for bias and what we still cannot fix.
Do I have to upload my photo?
No. The free scan runs inside your browser, so no image, no landmark coordinates and no derived values are transmitted while you test. The paid report is the one place a photo is uploaded. That image is deleted within 24 hours and never used to train a model, and the full list is in what we do and don't store.
Can I improve my attractiveness score?
You can move your attractiveness score in a fixed order of evidence: photo conditions change it immediately, grooming and styling change it moderately over weeks, and bone-remodeling claims do not change it at all. The full ranking, with the evidence attached, is in how to get a prettier face.
Is the attractiveness test different for men and women?
The measurement is identical for men and women: the same 478 landmarks, the same five components, the same published weights. Only the reference distribution a value is ranked against differs, which is why the same geometry can rank differently.
References
Every claim above, traceable
- Langlois et al., Psychological Bulletin 2000 - meta-analytic review: raters agree on facial attractiveness at about r = 0.90 within cultures, and agreement holds across cultures.
- Hönekopp, Journal of Experimental Psychology: Human Perception and Performance 2006 - private taste accounts for roughly half the variance in facial attractiveness ratings.
- Rhodes, Annual Review of Psychology 2006 - symmetry, averageness and sexual dimorphism are reliable but modest predictors of rated attractiveness.
- Langlois and Roggman, Psychological Science 1990 - digital composites of 16 and 32 faces were rated more attractive than almost all the individual faces averaged into them.
- Grammer and Thornhill, Journal of Comparative Psychology 1994 - symmetry and averageness both relate to rated facial attractiveness.
- Jones and Jaeger, Symmetry 2019 - averageness and sexual dimorphism predicted female facial attractiveness; symmetry did not survive the same controls.
- Perrett et al., Nature 1998 - female raters preferred slightly feminized male faces over masculinized versions of the same faces.
- Holland, Aesthetic Plastic Surgery 2008 - the Marquardt phi mask fits fashion models rather than the general population.
- Pallett, Link and Lee, Vision Research 2010 - optimal facial ratios sit close to population averages, not at 1.618.
- Buolamwini and Gebru, PMLR 2018 - commercial gender classifiers showed error rates up to 34.7% for darker-skinned women against 0.8% for lighter-skinned men.
- Grother, Ngan and Hanaoka, NIST IR 8280, 2019 - face recognition false-match rates ran 10 to 100 times higher for some demographic groups.