Score v1.0 · Last reviewed August 29, 2026 · Reviewed against our published editorial standards
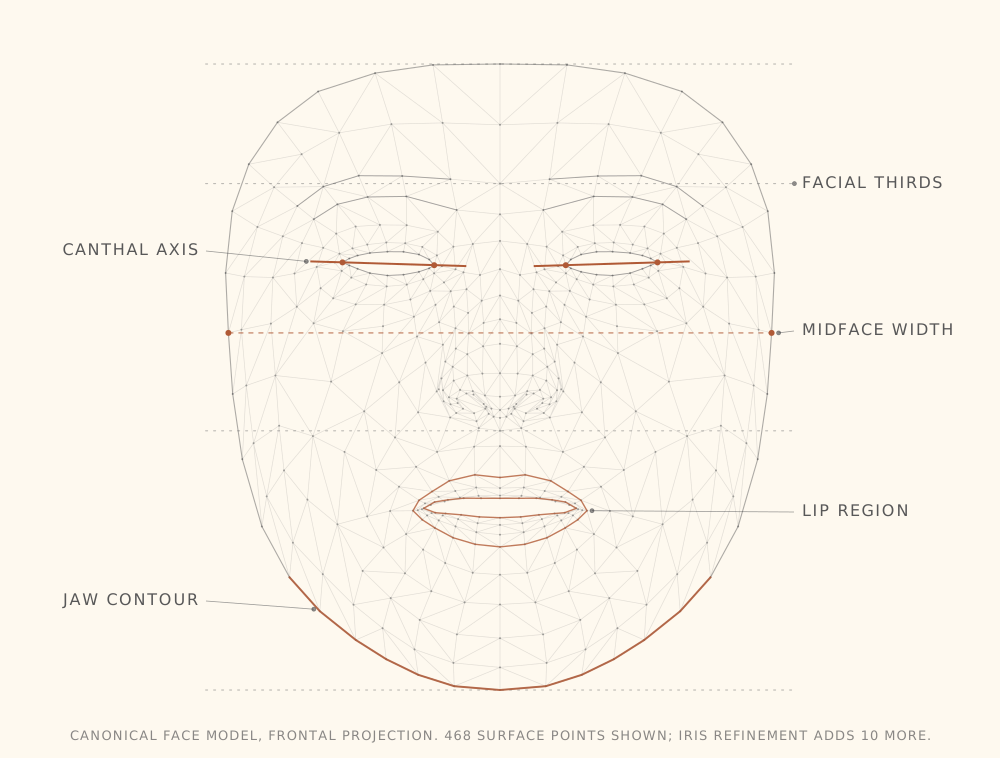
Every measurement runs in your browser on a 478-point landmark mesh; no photo is uploaded, stored or transmitted, which also means we cannot see the face we scored.
This page covers the accuracy and limits of an AI facial analysis method, analyzed on your device, not a verdict on your face. It sets the standard every claim below has to meet: reproducible, disclosed, and honest about where it falls short.
The Short Version
How Does the AI Measure Facial Attractiveness?
The AI measures facial attractiveness by mapping 478 landmarks onto your face and scoring their positions against a disclosed formula, entirely inside your browser. Those 478 points cover fine detail across the eyes, jaw, and cheekbones, not just their rough outlines. The mesh follows a MediaPipe-class design, compiled to WebAssembly and WebGL, so the analysis runs on your device's own processor.
No image is uploaded, stored, or transmitted to a server at any point in this process. This is the same guarantee stated across the site: photos never leave your browser. You can verify how your face is measured yourself. Open your browser's developer tools, click the Network tab, run a scan, and watch the request log: zero image-upload requests fire, because none are ever sent.
This mechanism is not unique to this page. It's the same engine behind the attractiveness test this method powers, applied identically everywhere on the site. The formula converts landmark geometry into a single Score v1.0 output, then, once a reference population is large enough to publish, compares that output against it to produce a percentile.
What Does the AI Actually Measure?
Facial attractiveness, measured as a construct, is composed of symmetry, facial proportions, facial harmony, averageness, sexual dimorphism, youthfulness and skin quality. This page does not extend to body attractiveness or to reading character from a face; both are named here once, and covered nowhere on this site. Score v1.0 scores five of those seven components and names the rest as not scored, each for the same reason: both need a reference-population embedding this instrument does not yet build.
What Is "Averageness" in Facial Attractiveness Research?
Averageness describes the finding that faces closer to a population's mathematical average are, on average, rated more attractive. The result surprises most people, who expect distinctive or unusual features to score higher, not average ones. The finding traces back to composite-photography experiments from the 1990s, when researchers began digitally averaging multiple faces and asking observers to rate the results. Langlois and Roggman's foundational 1990 study found that computer-averaged, composite faces were rated more attractive than most of the individual faces used to build them [1].
This instrument does not score averageness directly in Score v1.0. Doing so needs a reference-population embedding: a large, representative set of faces to average against. This instrument doesn't yet build that embedding.
What Is Sexual Dimorphism, and Why Does It Affect Scoring?
Sexual dimorphism refers to facial features that differ, on average, between men and women, including jaw width, brow height, and lip fullness. Interest in dimorphism grew out of 1990s evolutionary-psychology research, which framed masculine and feminine facial traits as possible fertility signals, a framework later cross-cultural studies complicated rather than confirmed. Scott and colleagues' 2014 study found that preference for masculinized or feminized faces is inconsistent across populations, not a universal rule [2].
This instrument does not score sexual dimorphism as a standalone value in Score v1.0, for the same reference-population reason as averageness. Averageness and sexual dimorphism are two of the seven composed-of components. The other five, symmetry, facial proportions, facial harmony, youthfulness, and skin quality, are scored today, and they don't always agree with each other.
The Attractiveness Research Framework
Everything on this site that gets measured, described in words instead of a number, or explicitly left out is organized under one structure: the Attractiveness Research Framework, or ARF. The ARF is not a second scoring model and it does not change the weights above. It is the editorial map that sorts the free scan, the paid report, and every guide on this site into the same five areas, so a claim about optimization is never quietly substituted for a claim about structure.
| ARF area | What it covers | Where it shows up on this site |
|---|---|---|
| Structure | Proportions, symmetry, facial thirds and fifths, fWHR, and the geometry a landmark mesh can capture directly. | The scored components above: symmetry, thirds, the golden ratio proportion, fifths, and harmony, each at a published weight. |
| Features | Eyes, brows, nose, lips, chin, jaw, cheekbones, and forehead, considered one at a time rather than as one composite. | The feature level detail in the paid Attractiveness Report, plus averageness and sexual dimorphism, both named above and both not yet scored in Score v1.0. |
| Presentation | Expression, hair, grooming, skin presentation, lighting, photography, angle, and photo quality. | The photo gate that checks yaw, pitch, roll, and expression before a scan runs, and the flags that name which condition moved a score. |
| Context | Culture, individual preference, environment, and the rater to rater variation the research documents. | The reference population a percentile will be compared against once one exists, and the honest limits stated in the sections below. |
| Optimization | Grooming, hair, skincare, styling, photography, and realistic, non-invasive change, ranked by evidence rather than by what is easiest to sell. | The ranked order to work in inside the paid Attractiveness Report. |
The ARF is an editorial structure, not a clinical instrument, and it does not add a component or a number anywhere on this page. Its job is narrower and more useful: it keeps a claim about your photo's presentation from being written as if it were a claim about your face's structure, on this page and everywhere else on the site.
How Accurate Is an AI Attractiveness Test?
This instrument is accurate in a narrow, testable sense: the same photo and the same Score version return the same number every time, using published, disclosed weights, not a hidden or guessed formula.
Accurate doesn't mean omniscient here. It means reproducible: the same input produces the same output, and the method producing it is published rather than hidden. Lighting and pose still affect any single scan's reliability, a limitation covered in full on the attractiveness test page itself, not repeated here.
This instrument has not published a confidence band, or a percentile. Both need something this instrument does not have yet: a test-retest reliability study, repeated scans of the same faces measured for consistency, and a reference population large enough to state its actual size honestly. Until both exist, no score on this site carries a confidence interval or a percentile rank, and neither is invented to fill the gap.
The weights behind Score v1.0 are published, not proprietary. They represent this instrument's calibration, not a universal constant: another instrument with different training data and different weights scores the same face differently, without either instrument being wrong. The full set:
| Component | Weight in Score v1.0 |
|---|---|
| Symmetry | 30% |
| Facial thirds | 20% |
| Proportion | 20% |
| Facial fifths | 15% |
| Harmony | 15% |
Dataset bias is an accuracy limitation here, not just an ethics footnote. Buolamwini and Gebru's 2018 Gender Shades study found commercial facial-analysis systems made errors of up to 34.7% for darker-skinned women, far higher than for lighter-skinned subjects [3]. The gap traces to training and reference data built on Eurocentric anthropometric norms, not to any real difference in attractiveness.
This instrument discloses its own reference population for the same reason: a score is only as fair as the population it was measured against. The ethics and fairness policy for handling that bias sits on a separate page; this page states the measurement limitation plainly, because burying it would make the accuracy claim above dishonest.
Why Do Two AI Tests Give Me Different Scores?
Two AI tests give different scores mainly because roughly half of attractiveness-rating variance is shared taste, and half is private taste that no formula can capture. Hönekopp's 2006 analysis of attractiveness judgments found this same near-even split holds across independent human raters, not just across instruments [4].
Beyond that split, platforms disagree by design. Some score on a 0-to-100 scale; others compress the same judgment into 1-to-10. Landmark counts vary too: some tools track far fewer than 478 points. Each platform also weights the seven composed-of components differently. Scale, landmark count, and weighting are three separate design choices, and any one of them alone is enough to move the same face's number.
A fourth measurement method, prompting a general-purpose AI chatbot for a numeric guess, disagrees with all of the above for the same reasons: no shared scale, no shared weights, no shared reference population. See how the chatgpt attractiveness test compares to a purpose-built landmark instrument like this one.
None of that disagreement changes one fact about your own number: it was compared against a population. What population, and how large, is the last honest question this page owes you.
What Is the Percentile Based On?
Your score was compared against a population in one sense already: the formula behind Score v1.0 was built and tested against a set of faces before it ever scored one. The sharper comparison, a live percentile ranking your score against other people's scores, is a separate feature. A reference population, in that narrower sense, is the full set of completed scans a score would be ranked against: our own scan corpus, not a national average and not a beauty database. Score v1.0 does not publish that ranking yet.
Building a reference population large enough to publish takes real volume, not a fixed launch-day dataset. That's why the sample size stays blank rather than showing a number that would not hold up: a small number, honestly withheld, beats a polished one that isn't real. Your score itself is not affected by this. Score v1.0 computes a value from your own photo immediately, using published weights; only the population-based ranking is missing.
What your score means depends partly on what it's compared against. The design ranks male and female scores against separate reference distributions once each is large enough to publish, because the underlying feature ranges differ by sex. The practical difference between those two distributions is covered in full on the 1-10 attractiveness scale. A confidence band is a second, separate withheld number, held to the same standard: the same status stated everywhere on this site. The full accounting of both, once they exist, is published in our face analysis study.
This section states what the evidence says, not what sounds persuasive. Every citation here is checked by a person before it ships, and re-verified whenever the Score version changes enough to affect the claims it supports. The four studies below anchor every research claim made on this page, from the averageness effect to the dataset-bias figures. None is presented as the final word on facial attractiveness research. Each is one well-replicated data point in a larger literature, cited so a skeptical reader can check the source directly instead of taking a summary on faith. Every claim on this page is checked against the ten editorial standards before publication.
This measurement method is the foundation of your Attractiveness Report, extended to every component this page describes, including the ones this free scan does not yet score.
It's one part of the Attractiveness Report, the site's instrument for testing, scoring, and understanding a face.